? USD/JPY Long-Term Wave Analysis 26 Nov ’18 ?
Subscribe
Hi traders,
The USD/JPY wave patterns are indicating a larger ABC bearish reversal if price manages to break below the support (blue) line of the uptrend channel.
USD/JPY
Daily
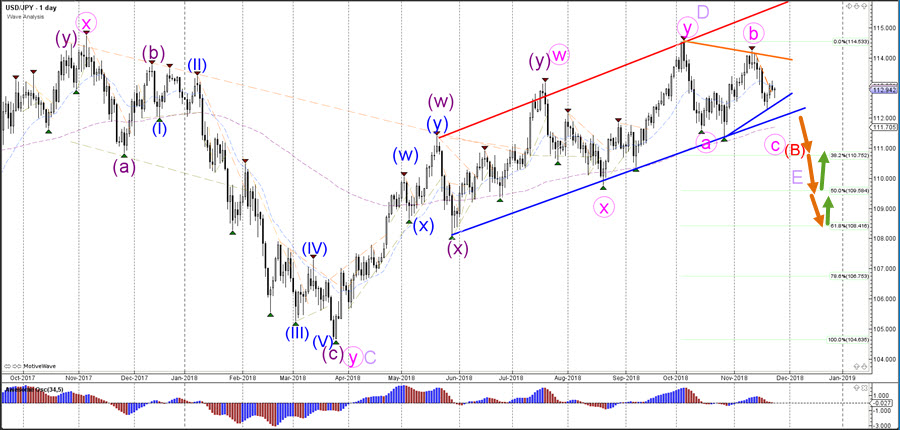
A strong bullish bounce, which takes price back to the resistance line, could indicate a triangle pattern between the S&R lines (orange/blue) rather than an ABC zigzag pattern.
Weekly

The USD/JPY is expected to build a larger wave E (purple). The confirmation occurs upon the bearish breakout below the channel. In that case the likely reversal spot is the 61.8% Fibonacci retracement level.
Monthly
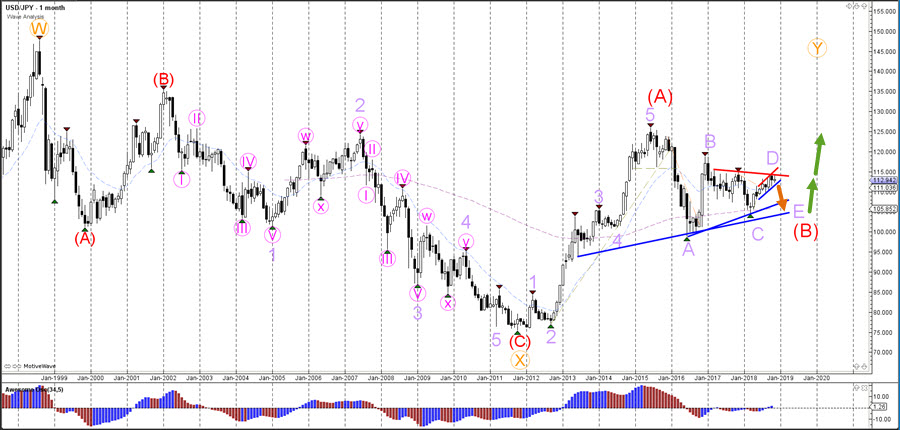
The USD/JPY is building a triangle pattern but it remains to be seen whether price will break the triangle to the downside or upside. The breakout will determine the bearish or bullish character of the triangle pattern.
For more daily wave analysis and updates, sign-up up to our ecs.LIVE channel.
Good trading,
Chris Svorcik
Elite CurrenSea


Leave a Reply