✅ USD/JPY Prepares Bearish ABC Zigzag Pattern ✅
July 6, 2018
2 min read
Subscribe
Hi traders,
The USD/JPY remains in a triangle chart pattern with the key decision zones marked by the support (blue) and resistance (red) trend lines.
USD/JPY
4 hour
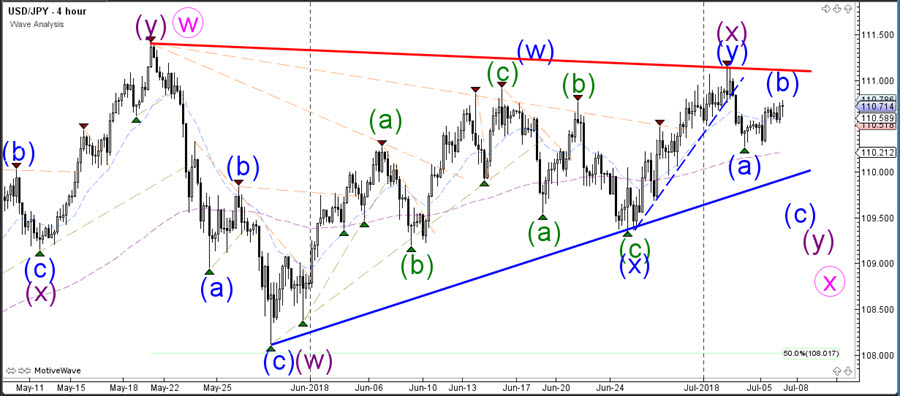
A bullish or bearish breakout of the triangle chart pattern is needed before the long-term vision becomes clear. The current bullish correction seems like a wave B (blue) but a break above the previous top would invalidate that.
1 hour
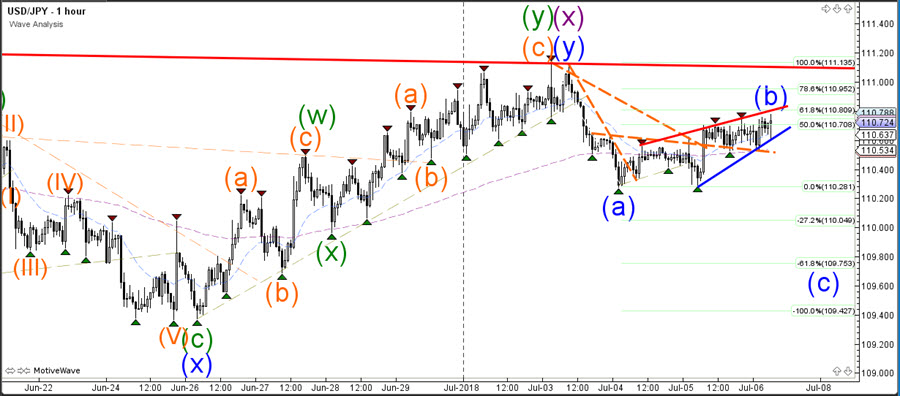
The USD/JPY seems to be building a rising wedge chart pattern as part of a wave B (blue). A break below the support trend line (blue) would indicate a bearish continuation towards the Fibonacci targets of wave C (blue). A break above the 100% Fibonacci level would invalidate the bearish ABC pattern.
Good trading,
Chris Svorcik
Elite CurrenSea


Leave a Reply