? USD/JPY Rising Wedge Reversal Pattern at 88.6% Fib ?
Subscribe
Hi traders,
The USD/JPY is building a rising wedge reversal chart pattern. A break below the support trend line could confirm the bearish breakout and end of wave B (pink).
USD/JPY
4 hour
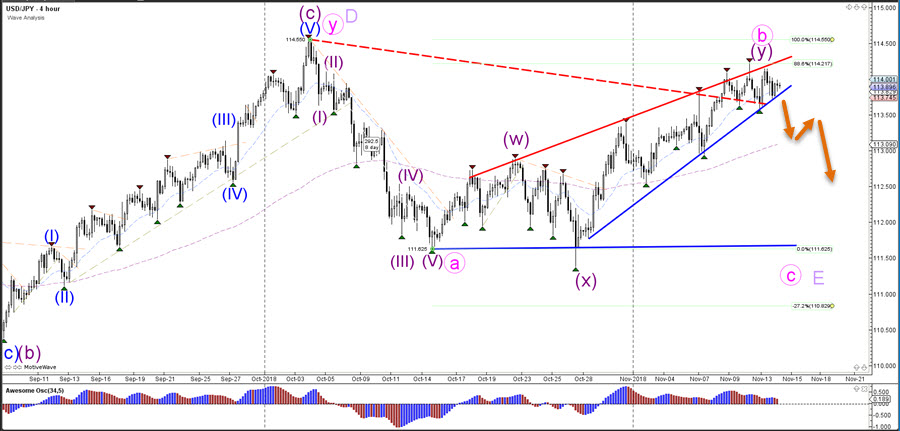
The USD/JPY bullish breakout above the 88.6% Fibonacci retracement level would make a wave B (pink) pattern less likely whereas a break above the 100% Fib level invalidates this pattern. The bearish breakout could be part of a larger bearish ABC (pink) in wave E (purple).
1 hour

The USD/JPY is building a contracting triangle chart pattern and is awaiting a breakout north or south. The breakout direction will determine the next trend. A bearish breakout would be aiming for the Fibonacci targets.
For more daily wave analysis and updates, sign-up up to our ecs.LIVE channel.
Good trading,
Chris Svorcik
Elite CurrenSea


Leave a Reply