? USD/JPY Testing Key Bounce or Break Zone at 109.15 ?
January 28, 2019
3 min read
Subscribe
Hi traders,
the USD/JPY is unable to break above the resistance trend lines (red) but did break below the support trend line (blue), which could indicate the end of wave 1 (purple) and the start of a bearish retracement within wave 2 (purple).
USD/JPY
4 hour
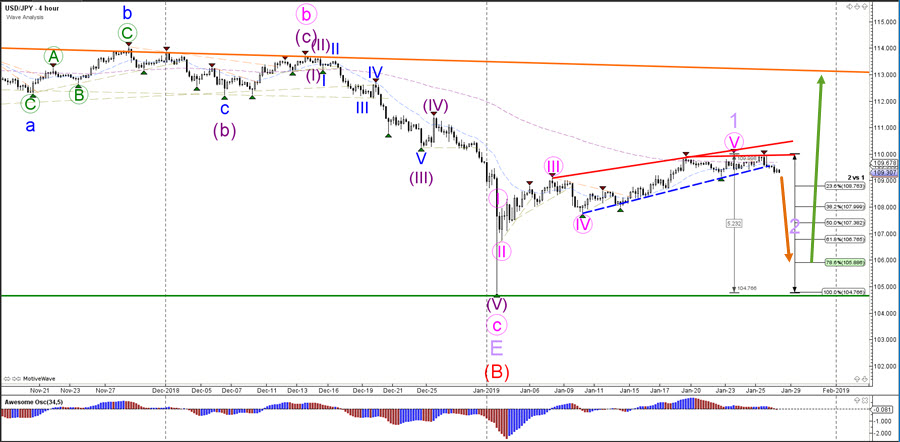 The USD/JPY usually retraces to a deep Fibonacci level such as the 61.8% or 78.6% when in potential wave 2 (purple). A break below the bottom and 100% Fibonacci level invalidates the expected wave 1-2 pattern (purple).
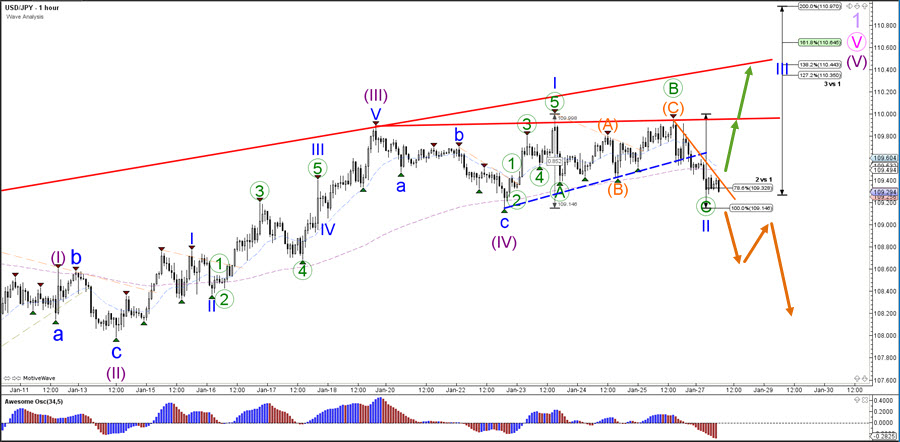
1 hour
For more daily wave analysis and updates, sign-up up to our ecs.LIVE channel.
Good trading, Chris Svorcik Elite CurrenSea


Leave a Reply