? GBP/USD Downtrend Prepares for Bearish Breakout below 1.35 Support ?
Subscribe
Hi traders,
the GBP/USD bearish momentum is slightly weakening but price action remains solidly in downtrend. A bearish breakout below the 1.35 support zone could see price fall towards the Fibonacci targets of wave 5 (purple).
GBP/USD
4 hour
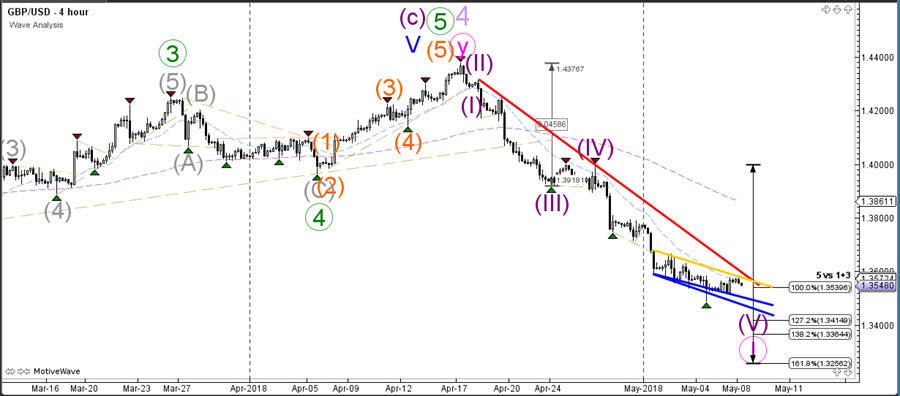
Price action remains bearish as long as price stays below the resistance trend line (red) but a bullish break above that resistance would indicate the completion of wave 1 (pink) and the start of wave 2. .

1 hour
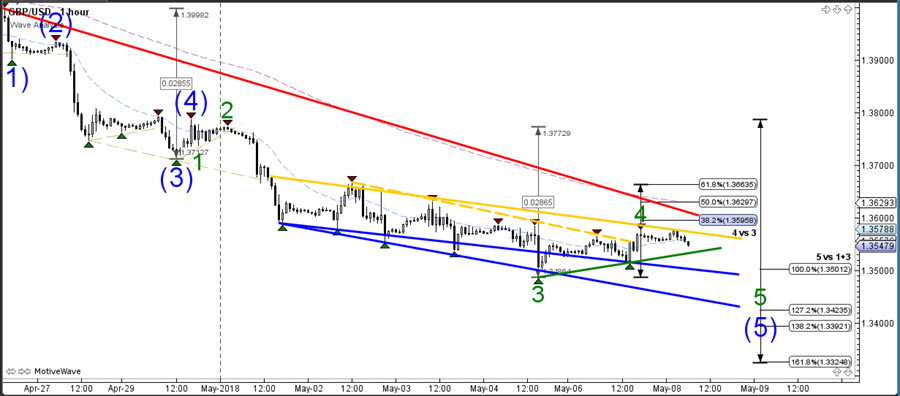
The GBP/USD could have completed a bullish retracement to the Fibonacci levels of wave 4 (green) which could act as a reversal zone for a downtrend continuation. A break above the 61.8% Fibonacci retracement level could indicate the potential end of the downtrend whereas a break below the support trend line (green) could indicate a downtrend continuation towards the Fibonacci targets of wave 5 (green).
Good trading,
Chris Svorcik
Elite CurrenSea
.


Hi Chris
I have been using your chart analysis for the last three weeks for info regarding GBP/USD and find the videos very helpful when making trades. Being a novice, You and Nenad have shown me so much info to start learning regarding chart analysis.
Please keep the charts coming and cannot thank you enough.
Many thanks
Lee
Hi Lee, so happy to hear it! 🙂 Thank you for sharing this with us, we appreciate that. Keep up the good work and wish you good trading!