? GBP/USD Testing 1.33 and Support of Key Trend Channel ?
Subscribe
Hi traders,
The GBP/USD is building a corrective channel but price is now challenging the support zone which is a key bounce or break spot. The reaction at the channel will determine whether price is back in the downtrend or expanding the 4th wave (purple).
GBP/USD
4 hour
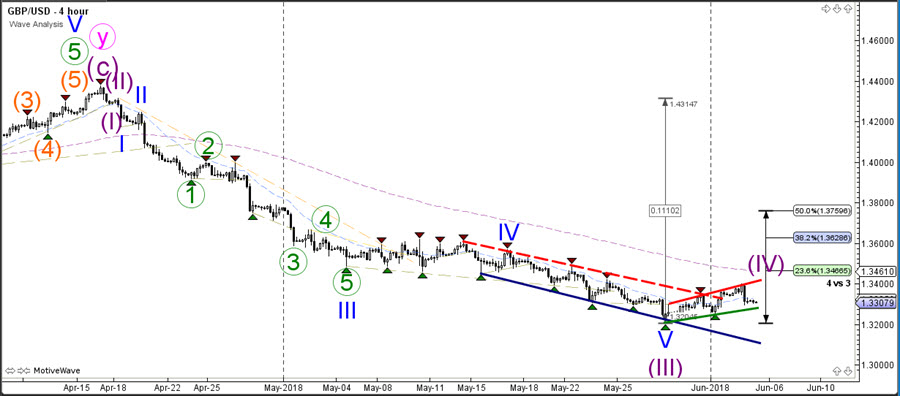
The Fibonacci levels of wave 4 vs 3 could act as resistance spots within the wave 4 pattern. A break above the 38.2-50% Fib zone indicates that the wave 4 is not likely anymore and price could be making a larger bullish pullback within wave 2. A breakout below the corrective channel could trigger the 5th wave down.
1 hour
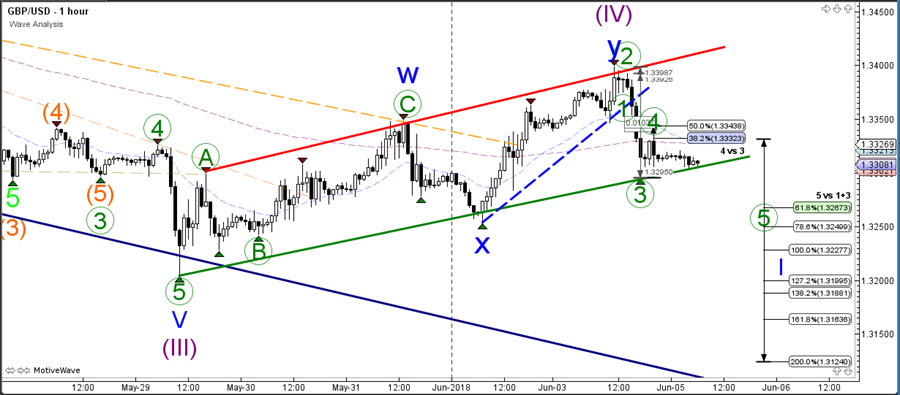
The GBP/USD is either building a bearish ABC or a 123 pattern. A break above the 50% Fib without breaking below the channel could indicate an ABC and the GBP/USD could be building a larger WXY correction within wave 4. This image is showing a potential breakout, which could be a wave 5 of a larger bearish wave 1.
Good trading,
Chris Svorcik
Elite CurrenSea
.


Leave a Reply