? USD/JPY Bullish Bounce Last Reversal Spot in Triangle ?
January 8, 2019
2 min read
Subscribe
Hi traders,
The USD/JPY is now testing a key resistance trend line (red). A bearish bounce could be part of the potential wave 1-2 (purple) pattern.
USD/JPY
4 hour
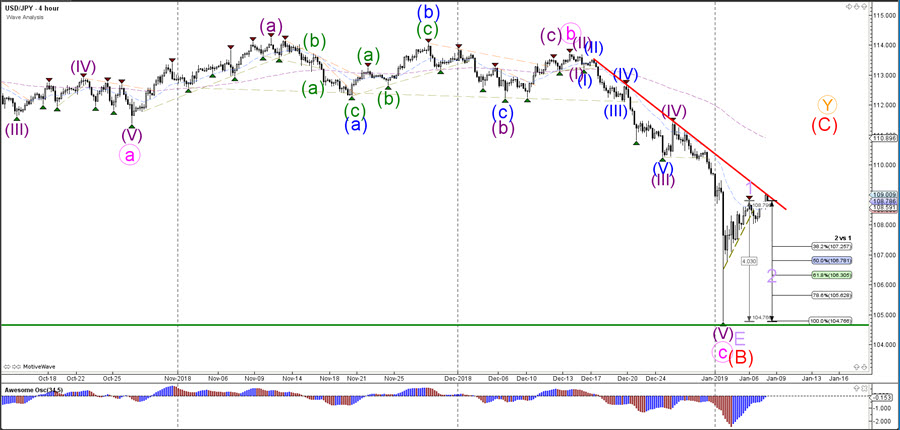
The USD/JPY bearish pullback would test the support zone of the Fibonacci levels of wave 2 vs 1. A break below the 100% Fib level invalidates the wave 1-2 pattern. A break below the green line invalidates the wave E (light purple) triangle chart pattern.
1 hour
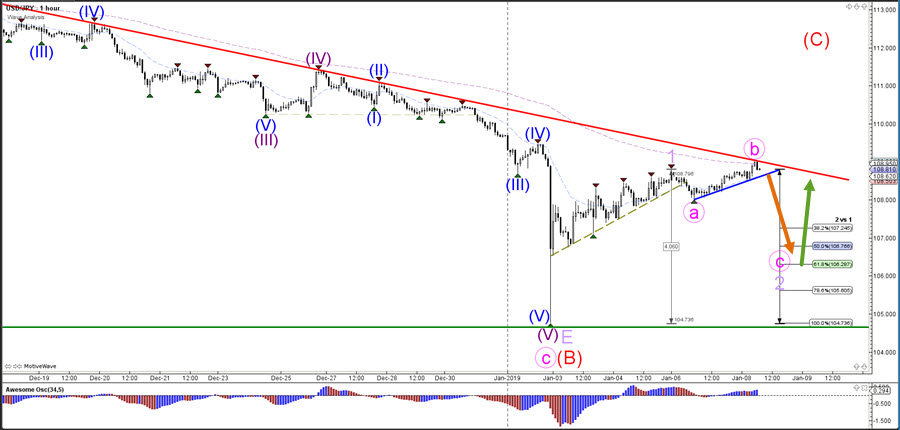
The USD/JPY needs to break below the support line (blue) before a larger correction could take place. A bearish break could indicate a wave C correction (pink).
For more daily wave analysis and updates, sign-up up to our ecs.LIVE channel.
Good trading,
Chris Svorcik
Elite CurrenSea


Leave a Reply