? Path of Least Resistance Explains All Forex & CFD Price Movements ?
Subscribe
Dear Traders,
Did you ever wonder why the Forex and CFD markets move so much on a daily basis? Although the long-term price movements are determined by large fundamental factors, the short-term is much more dependent on historical price movements that are visible on the chart.
This article introduces the “path of least resistance”, also called “marketmap” and how traders can use it to improve their chart analysis. It will also explain the two main factors that influence the path of least resistance and how traders can interpret these two components.
What on Earth is the “Path of Least Resistance” or “Market Map”?
Traders use a wide range of techniques to understand the price chart and find profitable entry points, ranging from technical analysis to wave analysis and from price action and candlestick patterns to indicators. All of these methods are based on “historical price”.
Nenad, Chris, and technical traders in general analyse these price charts with historical price to study how price moved in the past, which in turn, offers information about how it will move in the (near) future.
This technique is not only used in Forex and CFD trading but is equally valid for a wide range of topics such as weather, geology shifts (movements of continents), changes in the universe (change in planets, stars and universes), climate change, consumer patterns and much more.. Historical data is also used for instance to understand, improve and forecast traffic jams, political changes, economic trends and a whole range of fields. Historical data is always a key component of any analysis.
Generally speaking, analysing the past helps us predict the future. The same is true for charts: analysing past price helps us predict the future of price movement. But traders must realise that the accuracy rate goes down when looking further into the future, which is why it’s more accurate to say: analysing the past helps us predict the immediate future.
Why do we emphasize the “immediate” future? Because forecasts are most reliable in the short-term and become more difficult when applied to the more distant future.
The reason is simple: the further we look into the future, the more difficult it becomes to analyse all aspects – including current, hidden, and unknown factors – because there are more variables along the way that can impact the potential path.
Simply said, the path of the future can run in many different directions and it is much easier make a forecast when analysing events close to now. This is also valid for the markets and the charts.
To sum it up: price shows the historical path of least resistance up to now. Nenad, Chris and the entire ECS team use technical and wave analysis to understand what the future path of least resistance is likely to be and to see when and where interesting trades could develop.
Path of Least Resistance Examples
Let us take a look at an example such as the weather. Most people believe that meteorologists are bad at predicting the weather but studies show that nowadays the weather can actually be predicted with great accuracy (see Superforecasting: the Art and Science of Prediction” by Philip E. Tetlock and Dan Gardner.)
Although the weather forecasting is not seen as a field of study with high levels of accuracy, it is in fact surprisingly correct. In most cases when the weather team indicate that there is a 30% chance of rain, then three out of ten times it will rain and seven times it will not.
There is just one limit and one exception (see Superforecasting: the Art and Science of Prediction” by Philip E. Tetlock and Dan Gardner.):
- The time limitation: the accuracy is valid for up to seven days in advance. After day seven the ability to forecast correctly diminishes quickly and people are usually better off with the average climate data.
- The exception: accuracy levels drop when rain chances decrease to an expected 0 to 5-10%. Why? Meteorologists tend to overstate the chance of rain taking place because they do not want viewers to think that rain is impossible. They overestimate the rain chance slightly to help the viewers, who often have problems with grasping probabilities.
Although probability is an important aspect in life when taking all kind of decisions, humans unfortunately tend to be weak when trying to understand probability. A 30% chance of rain does not mean that there is no chance of rain or that rain is unlikely. It just means that out of 10 days, it will rain 3 times. But in the mind of most people, a 30% rain chance is almost equal to 5 or 0%. For most people, there is probably not much difference when the weatherman says that there is 5 or 30% chance.
Probability is important for understanding price charts and the path of least resistance. The path of least resistance is not fixed in stone but rather something more flexible.
Another way of understanding price and the path of least resistance is by comparing it to a stream of water like a river running down the hill. The water will find its path to a larger river or to a lake by choosing its path of least resistance around bigger rocks and setting aside smaller rocks. Price of course does not make a left, right or straight motion but an up, down or sideways but otherwise it is comparable to a river.

The Dynamics of Flow vs Resistance
The strength of the resistance versus the strength of the flow will determine the path of least resistance for rivers and price.
This means that traders can assess each situation on the chart and then determine the probability that price will continue higher, lower or sideways by analysing the flow and resistance.
What is flow and resistance for price charts? Let’s explain:
- Strength of the flow:
- River: flow is the strength of the water current.
- Trading: flow is the strength of price action such as candlesticks.
- Strength of resistance:
- River: how massive and large is the object blocking the flow.
- Trading: how strong is a key support or resistance level on the price chart.
The decisive factor is whether the flow or the resistance is stronger. This will determine whether price will move with the trend or reverse and whether it will move up, down or sideways.
For more information about analysing support and resistance, check out our ultimate guide for analysing and understanding S&R.
Let’s again examine a river (or creek) to simplify the concept: at points with resistance, the water will move around or away from the object. When the power of the water flow picks up, it will be easier for the water stream to push aside stronger points of resistance.
The most important factor is compare flow versus resistance:
- If the flow of the water is slow, then a rock could be strong and big enough to not get knocked aside and water could change its path to the left or right.
- If the flow of the water is strong (its mass and or speed), then a rock might be too weak to stand on its spot and it could be pushed aside. In this case, the path of the water did not change (or hardly changed) as the rock was moved.

The same principle that is used for a river (flow versus rocks) can be used for price. With price charts, the flow and resistance can be understood by analysing these two aspects:
- Flow: the strength or indecision of the bars or candlesticks.
- Resistance: the strength or weakness of the support or resistance levels on the chart.
Like with a river, the interaction between flow and resistance determines the path of least resistance for the object, which is a river or price:
- Strong(er) price action breaks through weaker) support or resistance level.
- Weak(er) price action fails to break through strong(er) support or resistance level.
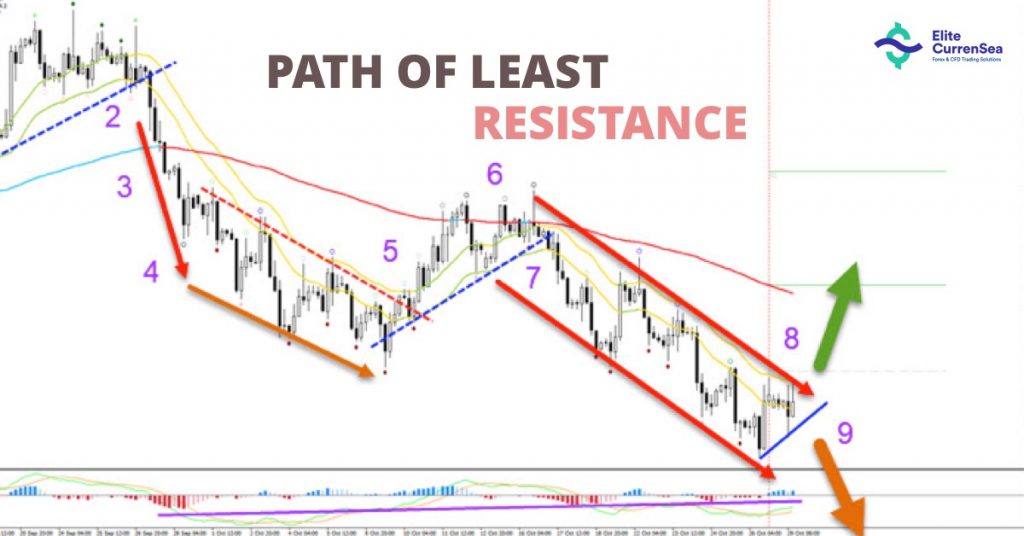
Let us take a look at a practical example – see the image above. Starting from left to right:
- Price was in an uptrend as price was moving away from the moving averages.
- Price broke below the support of the 21 ema zone which started bearish momentum.
- The bearish breakout was a key factor for the start of the downtrend.
- The strong bearish candlesticks broke through any of the support areas that were there.
- The bearish momentum weakened and eventually price made a retracement above the 21 ema zone and back to the 144 ema long-term moving average.
- The 144 ema was a bearish bouncing spot because the trend was down as the alignment of the MA’s showed.
- The break below support created a new bearish breakout and channel.
- There is a divergence pattern between the price bottoms and the bottoms of the oscillators (purple line), which could indicate that momentum is becoming weaker. Also a support level at 1.13 could stop price from moving lower. A bullish breakout (thick green arrow) above the channel would confirm the reversal.
- A break below the support and bottom could still indicate that the downtrend will make one more lower low (thick orange arrow).
Now you too know the magic of the MARKET MAP!
The above logic might seem complex to you at first but we explain the entire approach step by step in our ecs.SWAT course.
The most important aspect to understand is that:
- As long as the flow is strong, momentum is likely to last unless a massive confluence of support or resistance is nearby.
- As long as the flow is weak, support or resistance is likely to stop price unless a significant breakout occur.
- Make sure to check out our future articles where we explain how to measure support and resistance and the flow / momentum in more detail.
Join our World of Trading by starting with ecs.SWAT or ecs.LIVE !
Good trading,
Chris Svorcik
Elite CurrenSea


Leave a Reply