Quick Guide: 6 Best Advantages of Using Moving Averages
Subscribe
Dear Traders,
Not everyone uses indicators on their chart. Although price action in general and candlesticks in specific offer lots of value, I always add a couple of tools that are irreplaceable such as Fractals, oscillator, trend lines and Fibonacci.
One my favourite ones for understanding the path of least resistance are moving averages. Of course, I do not use them for trading simple crossovers like beginning traders often do.
This article will explain how traders can use moving averages to benefit everyone’s trading and analysis starting with understanding the path of least resistance, showing trend, showing support and resistance, etc.
Path of Least Resistance
Price moves up and down in a similar way as water moves down from the hills: it chooses the path of least resistance.
Here is how a stream of water responds to weak and strong objects:
- If water faces a strong obstacle such as a bolder, it will naturally go around that object and find a different path.
- If water faces a weak obstacle such as a pebble, it will naturally push it aside and continue on the same path.
The movement of price has the same role as water. Support and resistance (S&R) takes the spot of bolder or pebble:
- Stronger price breaks through weaker S&R.
- Weaker price stops at stronger S&R.
Our ecs.SWAT system is designed based on price patterns, an oscillator and moving averages (MAs). By understanding these 3 tools, traders naturally will spot the path of least resistance and they will be able to find high probability trade setups within this path. We explain this process in depth during our ecs.SWAT course but this article focuses on explaining more details about MAs.
Moving averages help us understand the path of least resistance in multiple ways:
- When price is strong, then the moving averages will be aligned and they will show a trend. In this case the moving averages will act as a continuation spot for the trend.
- When price is weak, then the moving averages will be on top of each other and flat, which indicates a range. In this case support and resistance levels will have more impact on price.
Important Aspects when Analysing Moving Averages
How do we use moving averages? There are multiple aspects that are key when analysing the chart, although not all factors are analysed at the same time. To understand the path of least resistance for price, these elements are at times part of our equation when analysing chart and assessing potential trade setups.
First, I should add that ecs.SWAT works with 3 moving averages:
- Short term HMA
- Medium term 21 ema
- Long term 144 ema
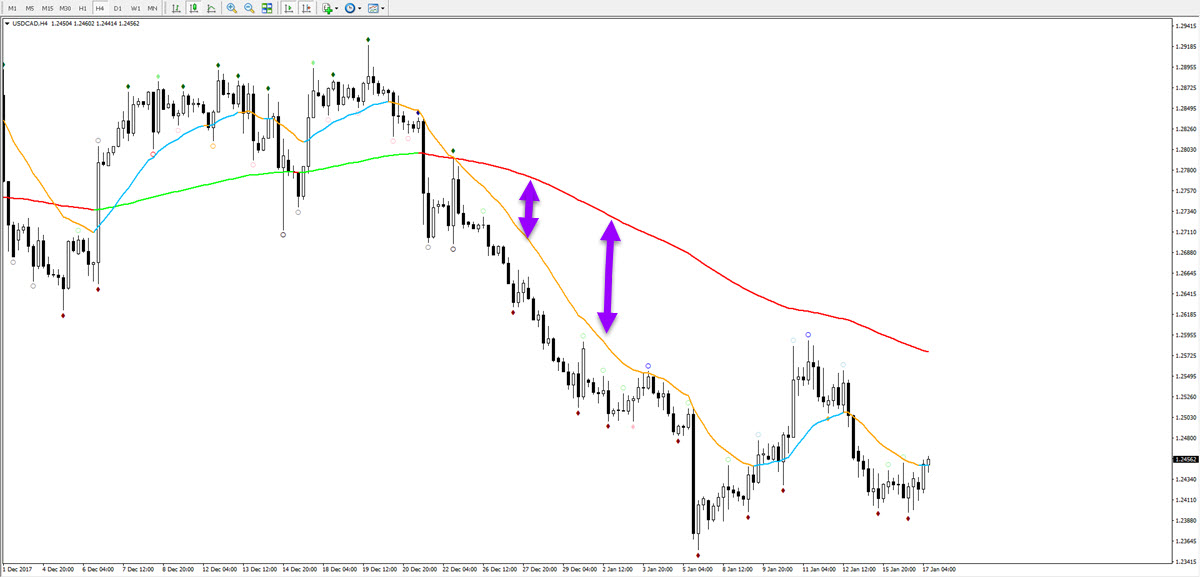
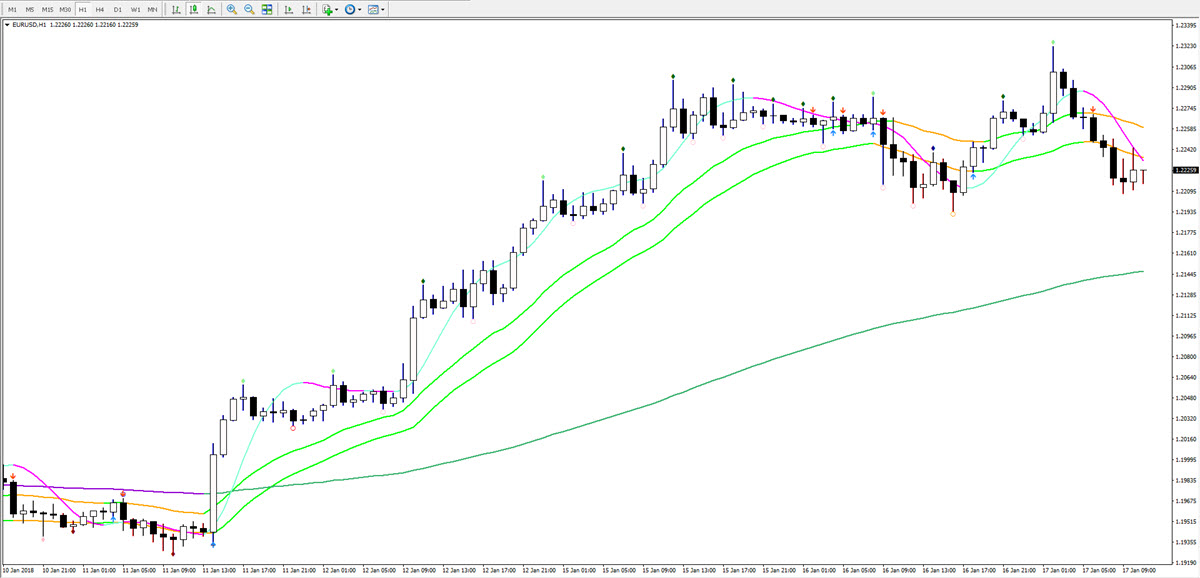
Factor 1: space between 21 ema and 144 ema
- No space: price is in a range and not trading. Price will have difficulties with breaking out and will respect S&R levels often.
- Small space: price might be starting a new trend (21 above 144 is uptrend and vice versa). This is when breakout trades could be interesting and a new momentum could start soon.
- Increasing space: price is showing strong or increasing momentum. Minor pullbacks on lower time frames are often good continuation trade setups.
- Big space but flat: price is building a correction. Patience is needed to wait for price to finish its consolidation and correction.
- Contracting space: price is building a reversal or retracement. Price is moving back from the 21 ema to long term 144 ema.
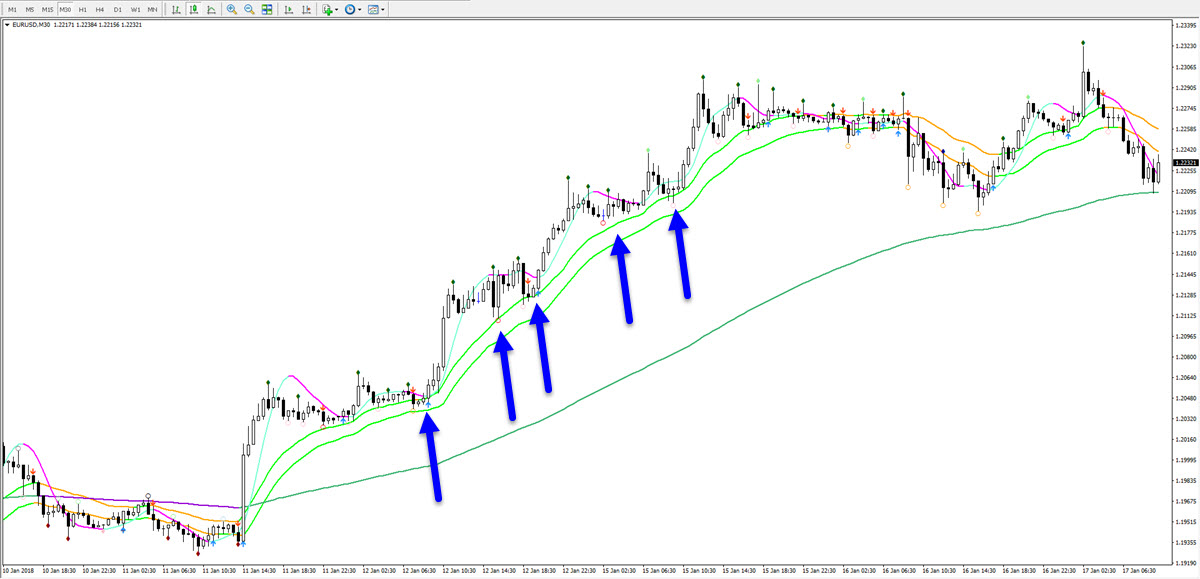
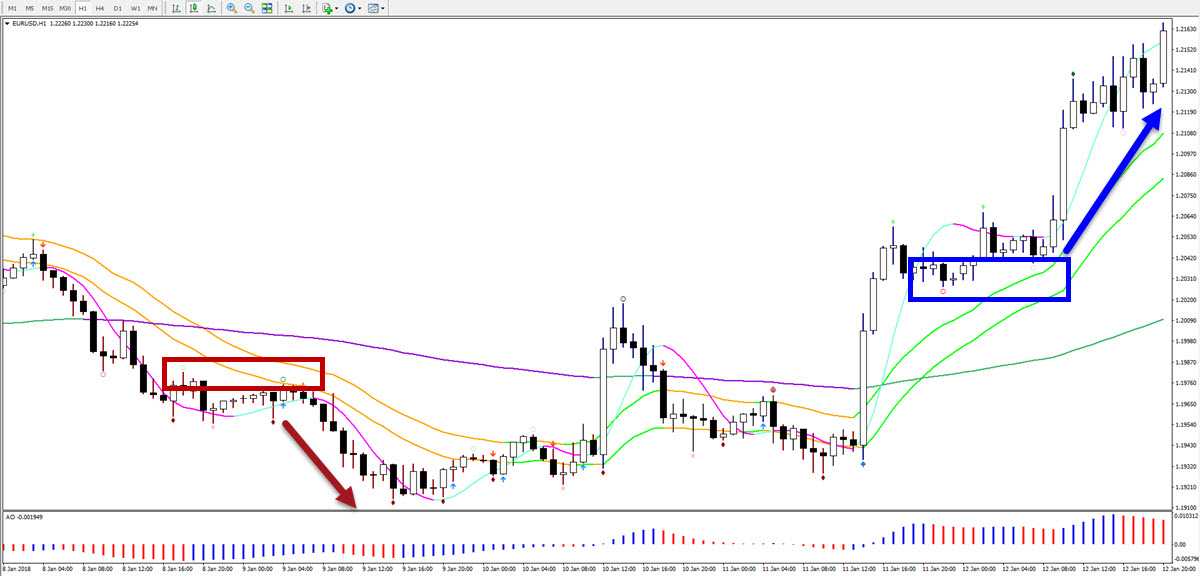
Factor 2: number of candles not hitting or touching the 21 ema.
Once strong momentum is visible on a pair and time frame, price will often move away from the average in a quick, impulsive fashion. This means that the candles themselves will not be near the 21 ema, neither the low or high is touching the 21 ema zone.
Price is often showing strong momentum when price moves away from the 21 ema for more than 5 to 10 candles. When price retraces back to the 21 emas, price will in that case often use the 21 ema zone a bounce and retracement spot for a continuation of the previous momentum.
Factor 3: divergence and 144 ema.
Eventually after price has made a couple of strong pushes either up or down, weakness will appear on the chart and create a divergence pattern. Divergence indicates that price is continuing with the trend but the power of the momentum is weakening, which in turn indicates that the chances of a reversal are increasing.
Divergence patterns do not play out immediately and can take time before they fully develop but it’s important to be on guard. The target for the divergence pattern is the 144 ema but price can extend beyond that if a reversal is taking place.
Factor 4: price breaking through 21 and 144 emas.
The break of price action through the moving averages is another factor that plays a role in my analysis, but not always. I am not entering a trade setup as soon as price is breaking through the 21 ema or 144 ema – it does depend a lot on other factors.
However, when price breaks into the opposite direction it is a warning signal that a new trend could be emerging:
- A break of the 21 ema away from the 144 ema could start a breakout.
- A 1st break of the 21 ema towards the 144 ema could indicate a minor retracement or a larger retracement.
- A 2nd break of the 21 ema towards the 144 ema could indicate a larger retracement.
- A break of the 21 ema after strong momentum could be a false break and only be a retracement within that trend.
- A first break of the 144 ema could could indicate an over extension of the correction.
- A second break of the 144 ema could could indicate a reversal.
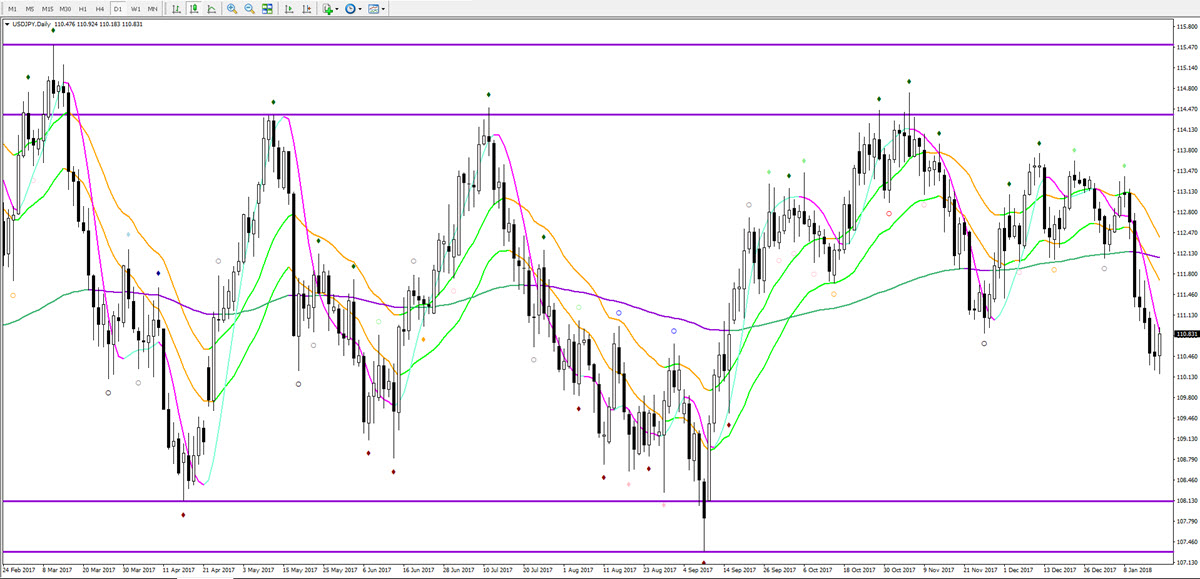
Factor 5: 21 and 144 emas crossing.
Crossovers are not good for taking entries. This is something that beginners often use as a simple entry and exit method. However, this concept does communicate information to traders.
When the 21 ema crosses the 144 ema, this means that price is either starting a period with a larger consolidation. Or price is about to confirm a larger reversal.
Factor 6: Fractals versus 21 and 144 ema.
The fractal indicator is a great help because it shows and plots key support and resistance levels automatically on the chart. Fractals at the 21 ema show that price is potentially using the emas as a retracement. Fractals at the 144 ema indicate a key bounce or break spot. In other words, they indicate a key level where price will either continue with the trend or reverse.
Basically, the emergence of fractals show support and resistance levels at the moving averages which indicate key S&R levels.
The factors mentioned in this article are not stand alone systems. They are aspects of trading that are used for analysing the charts in a deeper and more comprehensive manner.
Wish you good trading!
Chris
.


Leave a Reply