? GBP/USD Bounces at 38.2% Fibonacci of Wave 4 ?
Subscribe
Hi traders,
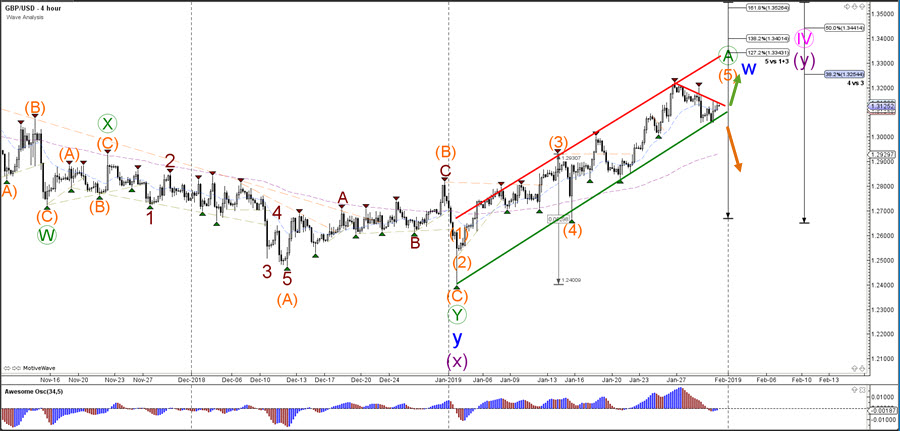
the GBP/USD is building a bull flag continuation chart pattern. A bullish break above the resistance trend line (red) indicates a potential continuation of the uptrend, which could aim towards the round level at 1.3250 and the FIbonacci levels of wave 5 vs 1+3. Ps. do not forget to check out our upcoming 4x Forex seminars on trading in Europe!
GBP/USD
4 hour
The GBP/USD could also break below the support trend line (green) of the uptrend channel. In that case a bearish reversal is taking place, which would indicate that wave A (green) has been completed at the recent high and that price is then most likely building a retracement within wave B.
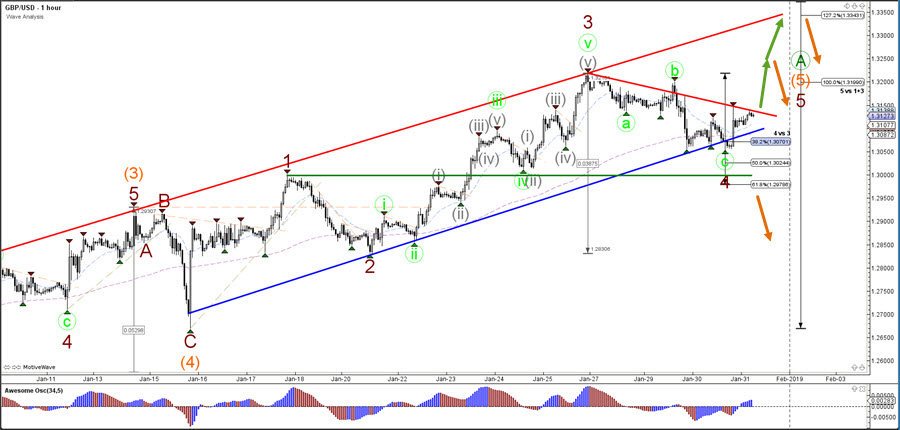
1 hour
The GBP/USD seems to have completed a bearish ABC (light green) zigzag correction within wave 4 (dark red). Price has also bounced at the 38.2% Fibonacci retracement level and price is now approaching the key resistance trend line (red). A bullish break could confirm the wave 5 (dark red) whereas a bearish break below the 61.8% Fib of wave 4 vs 3 would invalidate the wave 4 (dark red).
For more daily wave analysis and updates, sign-up up to our ecs.LIVE channel.
Good trading,
Chris Svorcik
Elite CurrenSea


Leave a Reply