? GBP/USD Long-Term Wave Analysis 19 Nov ’18 ?
November 19, 2018
2 min read
Subscribe
Hi traders,
The GBP/USD made a bullish bounce at the support zone (green), which seems to confirm the expected ABCDE (purple) triangle pattern.
GBP/USD
Daily
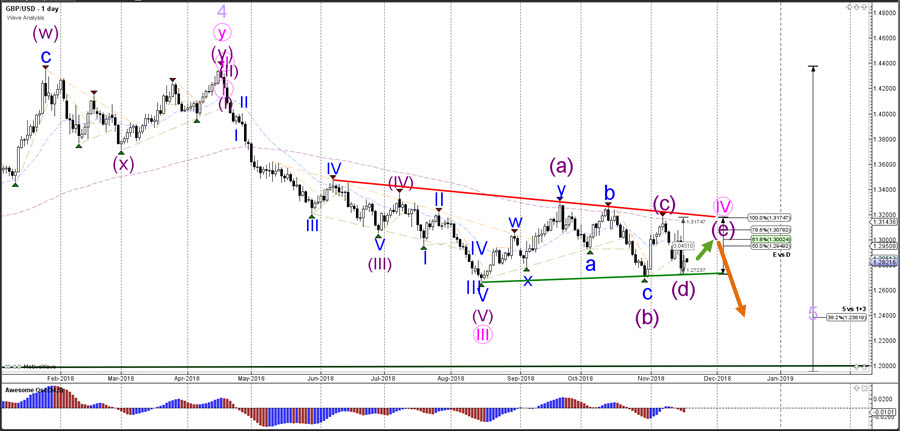
The GBP/USD is now testing the Fibonacci retracement levels of wave E vs D. A bullish bounce could move up as long as it stays below the 100% Fib otherwise the triangle pattern is invalidated. The triangle seems to be part of a larger wave 4 (pink).
Weekly
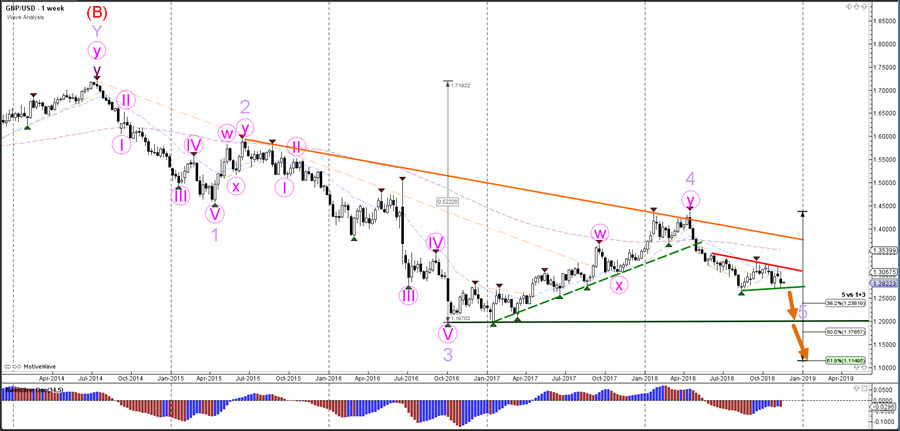
The GBP/USD is long-term in a strong downtrend and the current pause seems to be a small consolidation within that trend.
Monthly
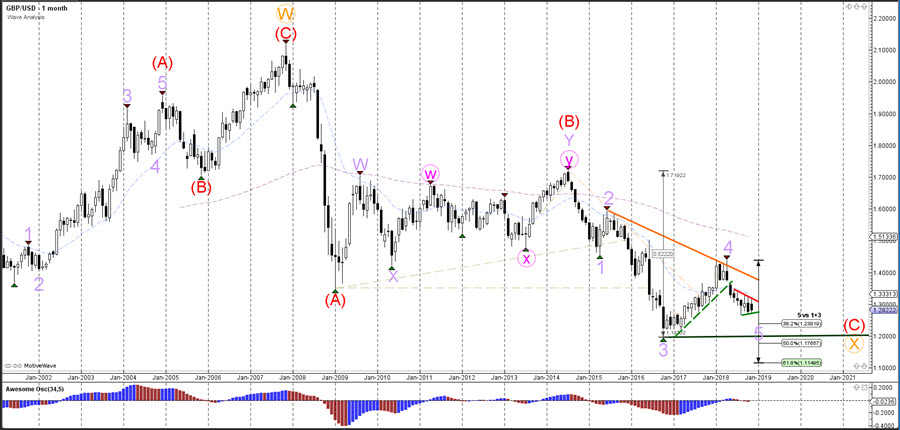
The GBP/USD bearish breakout could confirm a potential bearish wave 5 (purple).
For more daily wave analysis and updates, sign-up up to our ecs.LIVE channel.
Good trading,
Chris Svorcik
Elite CurrenSea


Leave a Reply