? USD/JPY Kicks Off Bearish ABC Zigzag Pattern ?
February 1, 2019
3 min read
Subscribe
 Hi traders,
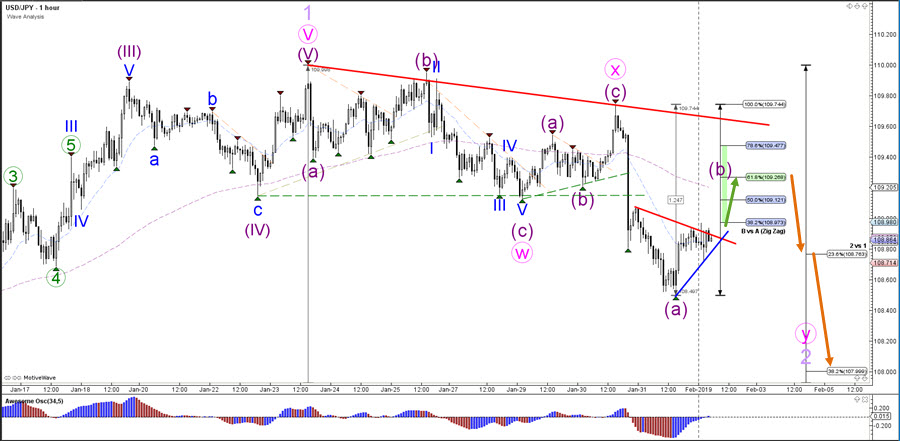
the USD/JPY broke below the support trend line (dotted green) of the sideways zone. The bearish breakout is now moving quickly lower towards the Fibonacci retracement levels of wave 2 (purple).
Hi traders,
the USD/JPY broke below the support trend line (dotted green) of the sideways zone. The bearish breakout is now moving quickly lower towards the Fibonacci retracement levels of wave 2 (purple).
USD/JPY
4 hour
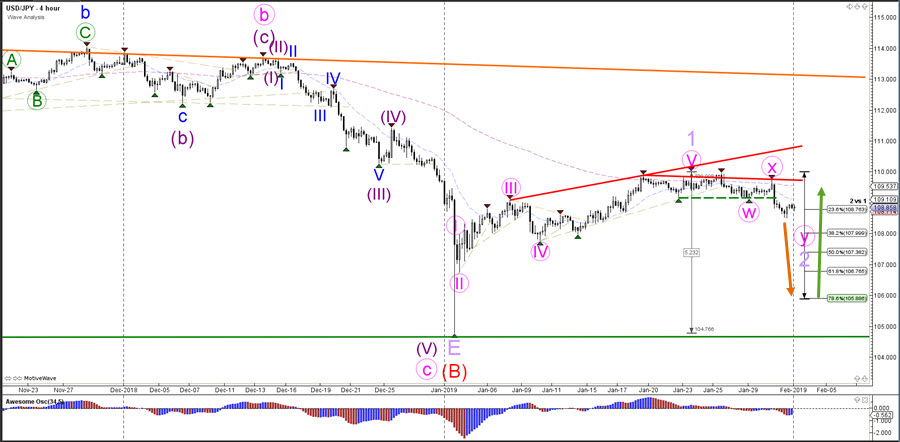 The USD/JPY is building a WXY (pink) correction within wave 2 (purple). The Fibonacci retracement levels of wave 2 are expected to act as potential support and bouncing spots for a bullish reversal as long as price stays above the bottom (green line).


Leave a Reply