? USD/JPY Long-Term Wave Analysis 16 Dec ’18 ?
Subscribe
Hi traders,
The USD/JPY is either building a large bull flag pattern for a bullish breakout or respecting the deep Fibonacci levels for a bearish reversal. The direction and next wave pattern will depend on the breakout direction above or below the trend lines.
USD/JPY
Daily

The USD/JPY is likely to be completing a bearish ABC (pink) wave pattern if price is able to break below the support trend line. A break above the 100% Fibonacci level and trend line (orange) invalidates the bearish wave pattern and could indicate an uptrend.
Weekly
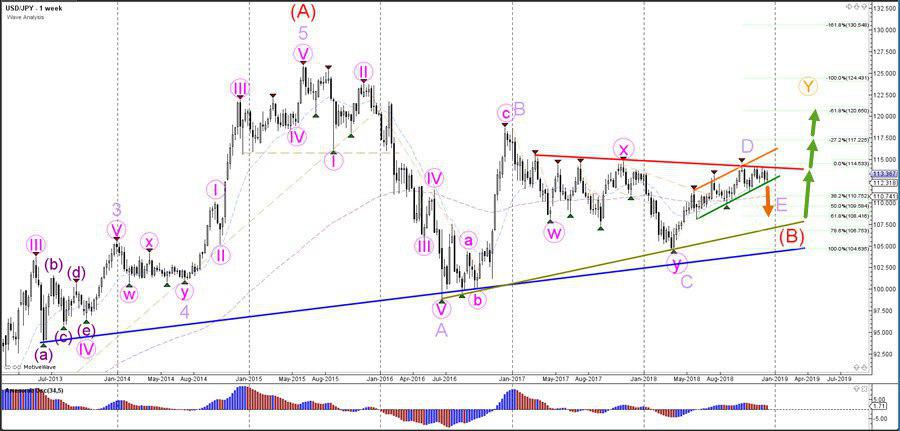
The USD/JPY seems to be building a large contacting triangle pattern and price is now expected to build a final wave E (purple). The confirmation occurs upon the bearish breakout below the channel. In that case the likely reversal spot is the 61.8% Fibonacci retracement level.
Monthly
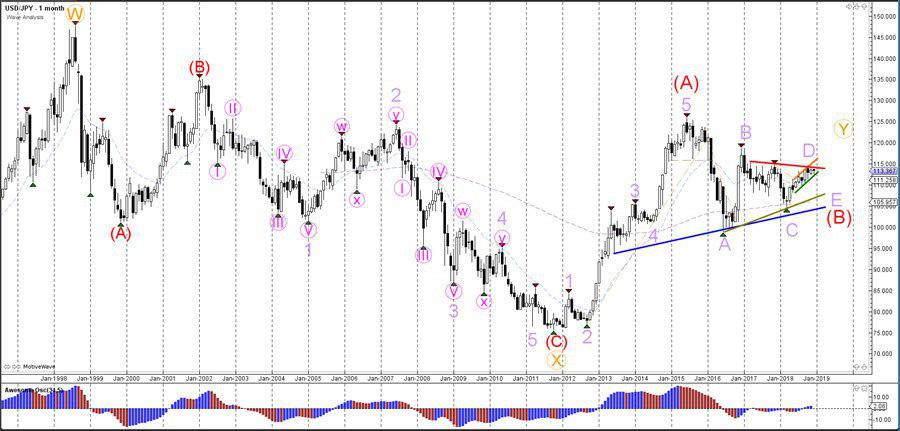
The USD/JPY is building a triangle pattern but whether price will break the triangle to the downside or upside remains an open question. The breakout will be the main factor for determining the next direction.
For more daily wave analysis and updates, sign-up up to our ecs.LIVE channel.
Good trading,
Chris Svorcik
Elite CurrenSea


Leave a Reply