? USD/JPY Tests Ultimate 88.6% Fibonacci Resistance Level ?
Subscribe
Hi traders,
The USD/JPY bounced at the broken resistance trend line (dotted red) and is now testing the ultimate and last 88.6% Fibonacci retracement level, which is the final decision zone for the wave B (pink).
USD/JPY
4 hour
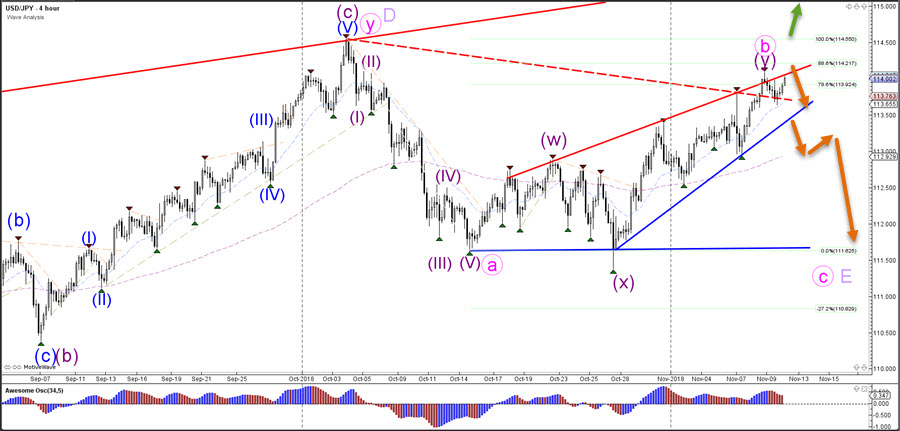
The USD/JPY bullish breakout indicates that a different wave pattern is likely to be valid whereas a bearish reversal could confirm the wave B (pink) and the start of wave C (pink) in larger wave E (purple).
1 hour
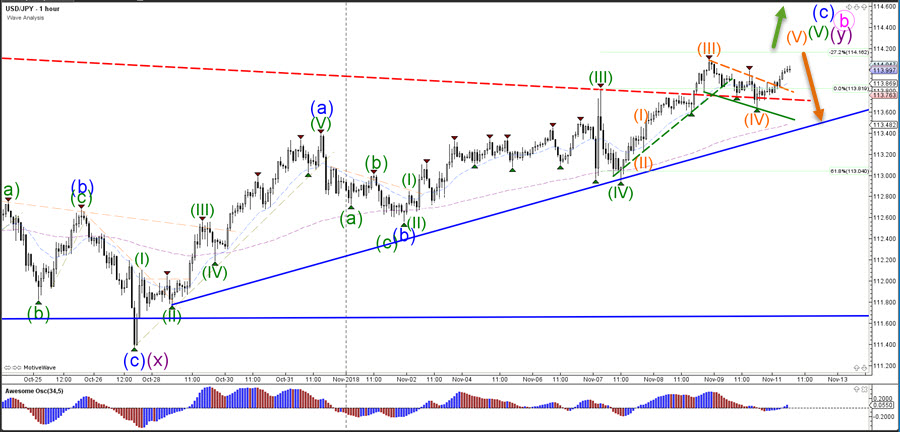
The USD/JPY seems to be building its final wave 5 (orange) of a wave 5 (blue) but whether price will start an uptrend or finish the bearish zigzag pattern remains unclear until we either see bearish or bullish price action or candlestick patterns become available at the 88.6% Fib.
For more daily wave analysis and updates, sign-up up to our ecs.LIVE channel.
Good trading,
Chris Svorcik
Elite CurrenSea


Leave a Reply